Yet Another Reset As Intel Unveils New Reporting Structure
Good times for Intel investors are unlikely until the foundry business is spun off.
Some investors have been expecting Intel (INTC) to make a major comeback in 2024 and 2025 based on two major promises from CEO Pat Gelsinger:
Return to process leadership with the 18A process, which, as a part of the 5 nodes in 4 years, was supposed to be manufacturing ready in H2 2024.
Return to product leadership with Sierra Forest and Granite Rapids CPUs in the data center.
As discussed below, these expectations were reset and the Intel recovery story now is going to be drawn out over 6 years – all the way through 2030.
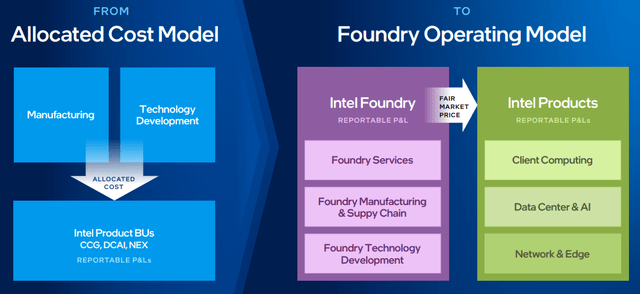
To be sure, the new reporting structure and operating model are the right things for Intel to do. The only problem is that this call should have happened years back – at the very beginning of Pat Gelsinger’s tenure or, better yet, during the reigns of CEOs prior to Gelsinger.
The new organization and reporting structure (image below) will no doubt drive lower cost structure and more efficient decision making.
Intel Foundry’s new P&L would look quite ugly with the changes. Note the -37% operating margins and $7B operating loss!
Intel gave a historic look back and what this segmentation would look like. The Company’s past financials recast with the new model can be seen in the image below. When looking at the trends, one can see that all core operating segments of Intel are in decline – both in terms of revenues and operating income.
The charts below (same data as the table above) paint a good visual. Note that while the segment level revenues are roughly the same as the numbers we have seen in past financial releases, the operating income numbers are dramatically higher. This is because, under the new structure, Intel assigns much higher expenses to the foundry group.
A higher product level profitability means corresponding massive losses in the foundry segment (see image below). Note that, as one would expect, foundry revenues are declining as Intel loses market share and as product revenues decline. The blip in 2022 is likely because Intel used many expensive wafers and overbuilt inventory causing the foundry revenues to look artificially higher.
Very clearly, and Intel admits in a roundabout way, the foundry financials are being kitchen-sinked and are bearing the burden of past excesses from the product groups. The other way of looking at it is that Intel is sacrificing foundry financials to make the product side look better.
To show that its Foundry business is on a sound footing, Intel continues to tout “5 nodes in 4 years” but the narrative is increasingly not credible. While Intel uses its own benchmarks to show that it is on track (image below), none of the advanced nodes have meaningful volumes even though Intel claims they are manufacturing ready.
Intel 4 is a low volume node and by Intel’s own chart (see the pink section of the chart below) we are not going to be seeing much of a ramp until 2026 even though it was supposed to have been manufacturing ready at the end of 2022. The pink section in the chart shows that Intel 3 will not have much volume on it either until 2026! Note that TSMC (TSM) has been shipping high volume N3 wafers since last year.
Intel is finally starting to admit that 18A, which is supposed to be manufacturing ready in H2 of this year will only have limited volumes in 2025 essentially making it a 2026 high volume node. As we can see from the image below, despite Intel 3, Intel 4, Intel 20A, and Intel 18A ramping in 2026, the dominant node that year is expected to be Intel 7 (and prior nodes based on the same Intel 10nm technology).
In contrast, 7nm class nodes contributed only 25% TSMC’s revenues in Q4 2023. By 2026, these nodes will likely contribute less than 10% of TSMC revenue. This should tell a lot about where Intel Foundry stands compared to TSMC in the foundry ecosystem.
It is not just the volume; we are also starting to see that Intel has started to lower expectations. Intel management used to make many “absolute superiority” leadership claims about 18A node but, as can be seen in the image below, management is claiming a rough parity on most metrics with a slight edge in performance per watt. Not surprisingly, the claims of leadership have now shifted to 14A process.
Keep reading with a 7-day free trial
Subscribe to Beyond The Hype - Looking Past Management & Wall Street Hype to keep reading this post and get 7 days of free access to the full post archives.


