
How Do OpenAI Deals With AMD, Broadcom & Nvidia Compare? Implications
Is Capital Is More Important Than Everything Else?

In a span of about three weeks, OpenAI inked three large AI infrastructure buildout deals with the top three AI accelerator leaders – Nvidia (NVDA), Advanced Micro Devices (AMD), and Broadcom (AVGO). The multi gigawatt deals have, in some ways, shaken up the AI hardware space and also put vendor financing in focus (see here and here).
Many analysts portray these deals as similar but there are some very subtle and interesting details that make them distinct. This article looks at the details and implications.
The Value Of Gigawatt
Before we get into the details of the deals, the first piece of data that investors need to reckon with is that projects and opportunities are now increasingly quoted in Gigawatts, or GW. This practice makes it imperative that investors understand the value of GW before proceeding with a more detailed analysis of the deals.
The one clear benchmark we have had about gigawatts was Jensen Huang of Nvidia’s comment a month back that the cost of 1 GW of buildout was $50B or more and at Nvidia’s opportunity was $35B or more.
A slide from recent Oracle (ORCL) investor day presentation offers a compelling alternative data point (image below).

Beyond The Hype estimates that this slide suggests that capex for 1 GW is closer to $30B with about $20B is for Compute, Network, and Storage. Note that this number is far less than Nvidia’s quoted $35B per GW of opportunity. What makes for this huge difference?
Beyond The Hype estimates that, for 2026, Nvidia, AMD, and Broadcom’s opportunity per GW are likely around $35B, $25B, and $15B, respectively. The discrepancy is in part because Nvidia commands the highest margins and because Nvidia provides the most complete solution bundle. AMD does not have the same amount of content in a buildout as Nvidia as the company currently lacks an ethernet switch solution and optics. AMD also does not bundle cables and other sundry pieces of solution as Nvidia does. Broadcom, in addition to having dramatically lower ASPs for the accelerator compared to Nvidia and AMD, also does not have the same amount of content as Nvidia. Mainly, Broadcom lacks a CPU although it could participate in the opportunity with custom CPUs in some cases.
Given the above dynamics, BTH suspects that Oracle’s numbers are based on Broadcom ASIC deployment for OpenAI. However, investors need to be aware that 2026 is a point in time and the cost per GW and solution content per GW will not be static. Companies are likely to progressively improve performance per GW with each generation. In other words, the cost of compute per GW will decline with each new product generation.
Another dynamic at play is that Nvidia’s margins are likely past their peak and are destined to fall as competition intensifies. With MI450 looking to be a very potent competitor to Vera Rubin, and with competitive trends likely to continue, Nvidia’s content per GW will and move in the direction of AMD and the ASICs. The same dynamic means that AMD’s pricing and margins are likely to strengthen as its products are more competitive with Nvidia’s.
The table below considers the above dynamics and others and summarizes the key elements of the deal (standout differences in red).
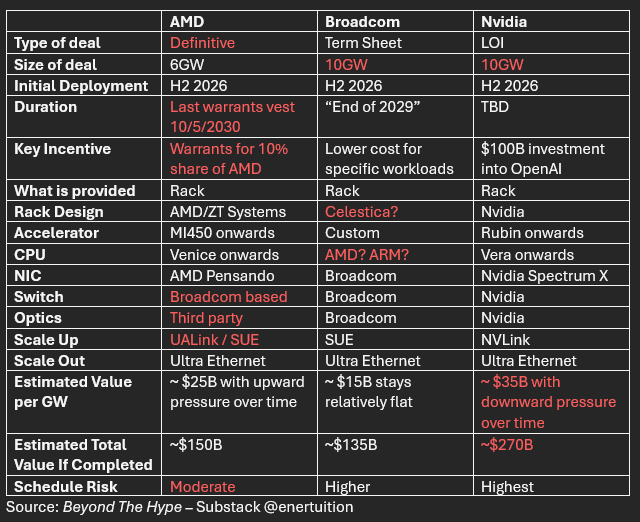
Among other things, note the size of the total opportunity. Vast majority of investors (and analysts) think that Broadcom’s OpenAI deal is bigger than AMD’s deal with OpenAI because the former is 10GW and the latter is 6GW. But, adjusted for ASPs and other factors, that is not true. Analysts and investors who see Broadcom as the #2 AI semiconductor play behind Nvidia have some thinking to do.
Note: In the deployments above, AMD will likely get meaningful CPU revenues in Broadcom and Nvidia deployments. Broadcom will get meaningful networking and optical revenues in AMD deployment and may even capture some revenue share of Nvidia deployment. Also, Nvidia could win standalone networking opportunities in some AMD and Broadcom deployments. This level of detail is being ignored in this table, but investors need to be aware that these companies have incremental upside not shown in the table above.
Implications
Keep reading with a 7-day free trial
Subscribe to Beyond The Hype - Looking Past Management & Wall Street Hype to keep reading this post and get 7 days of free access to the full post archives.